Implementation of Third Rapid Response Research Cruise Using Research Vessel “Hakuho-Maru” Following the 2024 Noto Peninsula Earthquake-Joint Research Cruise: Comprehensive Marine Geoscience Survey of Earthquake-Prone Areas-
Summary of the AIST Press Release on March 1, 2024,
>>Japanese
The research team comprising members from the Atmosphere and Ocean Research Institute (University of Tokyo), Japan Agency for Marine Earth Science and Technology, University of Toyama, Kyushu University, Earthquake Research Institute (University of Tokyo), Kanazawa University, Niigata University, Kobe University, Kochi University, University of the Ryukyus, Chuo University, Naruto University of Education, and the National Institute of Advanced Industrial Science and Technology is planning conduct a joint research cruise starting from March 4, 2024, using the research vessel Hakuho-Maru (Figure 1), following the 2024 Noto Peninsula Earthquake, which occurred on January 1, 2024.
Prior to this joint research cruise, rapid response research cruises were conducted using the Hakuho-Maru in January (first cruise) and February (second cruise) 2024. During these cruises, the installation and recovery of ocean bottom seismometers and other equipment enabled researchers to identify the source fault of this earthquake and investigate the mechanism of the earthquake and associated tsunami. The objectives of this third joint research cruise are as follows: A) conduct a high-resolution structural survey (Multi-Channel Seismic reflection survey) of the area where the 2024 Noto Peninsula Earthquake occurred to investigate the rise of deep fluids related to the earthquake and understand the potential risk of future earthquake; B) collect water and mud samples, measure heat flow in the vicinity of the seismogenic zone, image the seafloor deformation caused by the earthquake using a deep-sea camera, and install turbidity current observation equipment to investigate the influence of the earthquake and tsunami on the marine environment and marine ecosystem. The survey area map is shown in Figure 2.
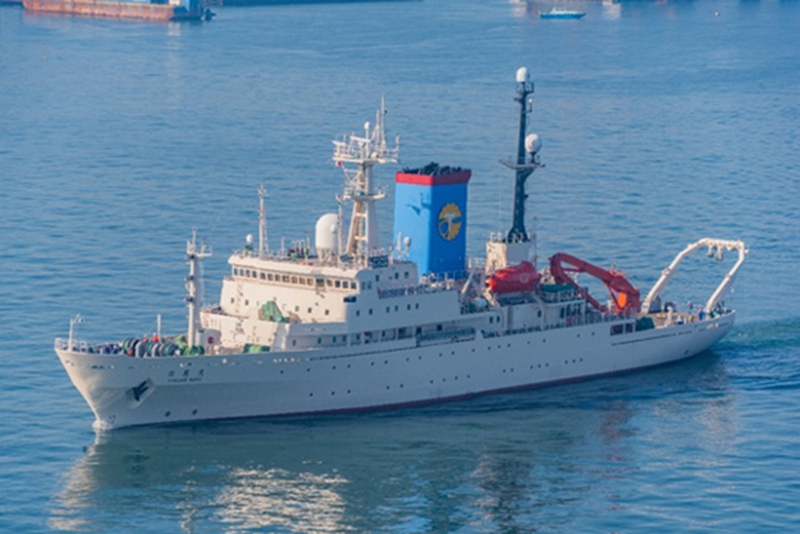
Fig. 1 Research vessel “Hakuho-Maru”
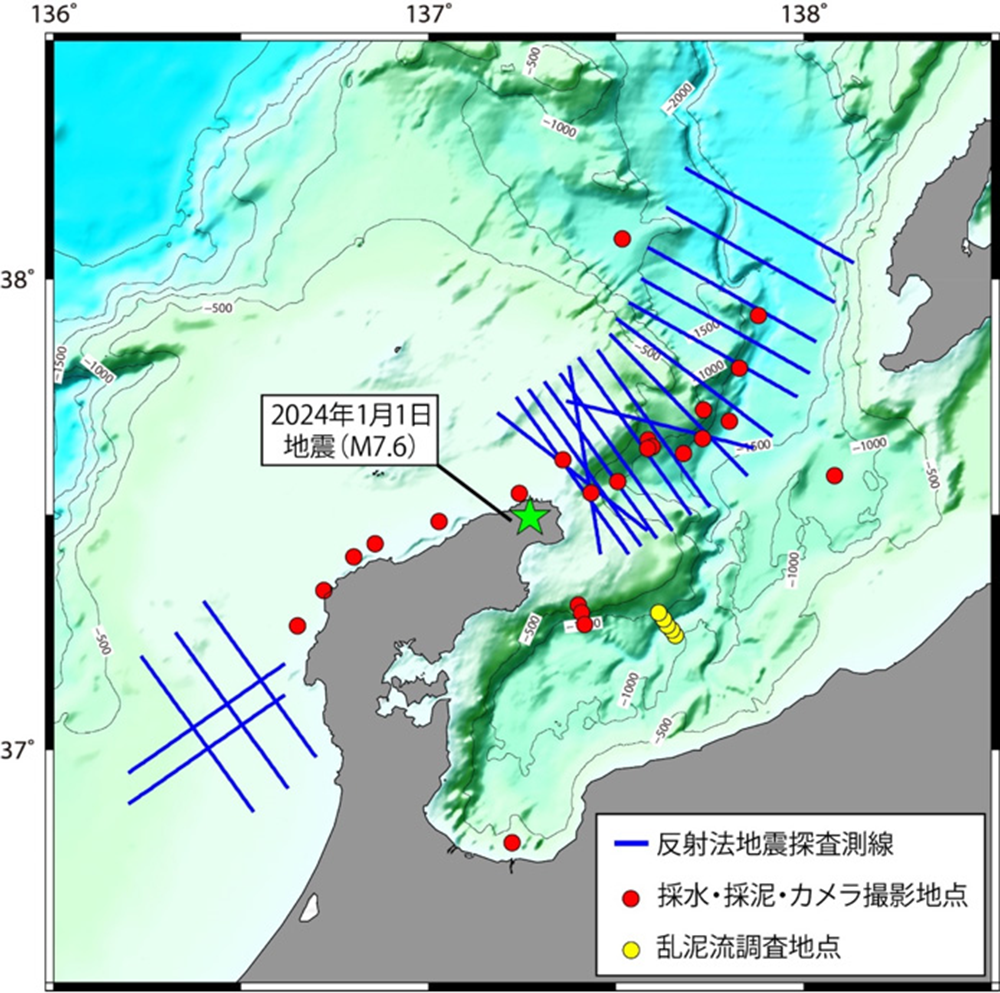
Fig. 2 Survey area map. The blue lines indicate the MCS survey lines, the red circles indicate the locations of water and mud sampling, heat flow measurements, and deep-sea camera imaging, and the yellow circles indicate the locations for turbidity current surveys.