Bulletin of the Geological Survey of Japan Top Page
Bulletin of the Geological Survey of Japan Vol.75 No.3 (2024)
Cover photograph | Table of Contents | Abstract
Cover photograph
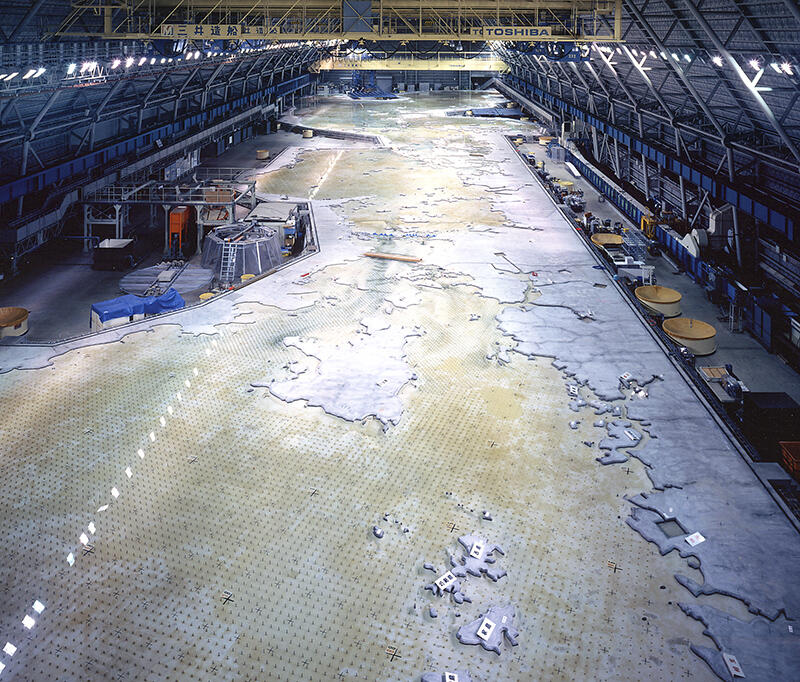
Large-scale hydraulic model of the Seto Inland Sea, Kure City
A large-scale hydraulic model of the Seto Inland Sea was constructed in Kure City, Hiroshima Prefecture, in 1973 to recreate the environment of the Seto Inland Sea, which has become severely polluted as a result of rapid economic growth. This was one of the world’s largest hydraulic models (~200 × 100 m in size), with a horizontal scale of 1:2000, and it was deconstructed in 2010. A real-world tidal difference of 2 m was represented as 1.26 cm in the model, and 1 year of real-world time by 55 h. The photograph was taken from ‘Osaka’ looking towards ‘Kyushu’, with ‘Honshu’ on the right and ‘Shikoku’ on the left. The model was used to calculate the rate of water exchange and to develop techniques to facilitate water exchange by modifying the topography.
(Photograph by YAMASAKI Munehiro, Caption by TAKAHASHI Satoru)
Table of Contents
All the pages PDF : 75_03_full.pdf [10MB]
| Title | Author | |
|---|---|---|
| Article | ||
| Seasonal Variation of Transportation of Manila (Asari) Clam Larvae in Hiroshima Bay | TAKAHASHI Satoru (p.83-91) | 75_03_01.pdf [3MB] |
| Report | Simple estimation of an S-wave velocity profile by adding one three-component geophone to a P-wave reflection survey line — Example of an exploration in Konosu City, Saitama Prefecture, Japan — | OHTAKI Toshiki (p.93-101) | 75_03_02.pdf[4MB] |
Abstract
Seasonal Variation of Transportation of Manila (Asari) Clam Larvae in Hiroshima Bay
TAKAHASHI Satoru
Hiroshima Bay in Japan is an enclosed bay with high biological productivity. In recent years, the population of Manila (Asari) clams in the bay has decreased rapidly, and the clams are now limited to the northern part of the bay. Various efforts to restore the clam population have had little success. In this study, I examined the dynamics of Manila clams in the planktonic larval stage by comparing field data with the results of a numerical model that tracks the larvae. Manila clam larvae are produced in spring and autumn each year. The model results show that the larvae produced in spring at the head of the bay (i.e., the northern part of the bay) are transported to the southern part of the bay, whereas the larvae produced in autumn remain in the northern part of the bay. These results are in good agreement with field data (e.g., the results of molecular analysis). In recent years, field observations have indicated small numbers of Manila clam larvae in the bay during spring. The small number of larvae transported southward during spring might explain why the clam habitat is limited to the northern part of the bay.
Simple estimation of an S-wave velocity profile by adding one three-component geophone to a P-wave reflection survey line — Example of an exploration in Konosu City, Saitama Prefecture, Japan —
OHTAKI Toshiki
In 2011 we proposed a new method to determine the S-wave velocity structure by combining P-wave reflection profiling with P–SV reflection waves observed with a three-component geophone. In that study, we applied this method to waveforms observed at a single geophone in a P–SV reflection survey line and obtained the S-wave velocity structure to a depth of 2 km below the surface. The result was in good agreement with those obtained both by the survey and vertical seismic profiling conducted near the geophone. In 2006, we conducted an experiment to obtain the S-wave velocity structure by using a three-component geophone combined with a P-wave reflection survey with vertical geophones in Konosu City, Saitama Prefecture. In the present paper, we provide the results of the experiment and the S-wave velocity profile obtained using the records of the three-component geophone. The P-wave reflection survey employed 192 vertical receivers, and the survey line was ~10 km long. Of the five locations where three-component receivers were installed along the survey line, only one provided sufficient data for analysis. Several P–SV reflected wave groups are observed in the receiver gather acquired by the three-component geophone, and the S-wave velocity structure below the receiver is obtained from the ground surface to a depth of 500 m.
Geological Survey of Japan, AIST
- About GSJ
- Our Activities
- Purchase guide
-
Publications and Database
- information
-
Bulletin of the Geological Survey of Japan
- bull2026(Vol.77)
- bull2025(Vol.76)
- bull2024(Vol.75)
- bull2023(Vol.74)
- bull2022(Vol.73)
- bull2021(Vol.72)
- bull2020(Vol.71)
- bull2019(Vol.70)
- bull2018(Vol.69)
- bull2017(Vol.68)
- bull2016(Vol.67)
- bull2015(Vol.66)
- bull2014(Vol.65)
- bull2013(Vol.64)
- bull2012(Vol.63)
- bull2011(Vol.62)
- bull2010(Vol.61)
- bull2009(Vol.60)
- bull2008(Vol.59)
- bull2007(Vol.58)
- bull2006(Vol.57)
- bull2005(Vol.56)
- bull2004(Vol.55)
- bull2003(Vol.54)
- bull2002(Vol.53)
- bull2001(Vol.52)
- Bulletin of the Geological Survey of Japan(old)
- Annual Report on Active Fault and Paleoearthquake Researches
- Reports, Geological Survey of Japan
- CCOP-GSJ Groundwater Project Report
- CCOP Technical Bulletin
- Cruise Report
- Geological Hazards
- Learning and Education
- GSJ Database Collection
- Collection of links